Clark/Lake is the busiest CTA station in 2026, with 2.66 million entries from January through August. The busiest bus route is the 9 Ashland, with 4.27 million rides. Here are the top 10 stations and bus routes, from the CTA’s own ridership counts.
Our most popular CTA stops and lines ranking comes from rides tracked by Transit Stats users. This one uses the CTA’s counts, published on the City of Chicago data portal, which cover every rider, not just our users.
CTA station and bus ridership in 2026
From January through August 2026, riders entered CTA L stations 80.6 million times, up 4.5% from the same months of 2025. Bus routes carried 135.3 million rides, up 2.2%.
Station entries count people passing through a station’s fare gates. Riders changing trains behind the gates aren’t counted, so a station’s total reflects trips that start there. That’s also why entries add up to less than the CTA’s total rail rides, which were 94.3 million over the same months.
The 10 busiest CTA L stations in 2026
Station entries from January through August 2026:
- Clark/Lake: 2,664,003 entries
- Lake (Red Line): 2,348,607 entries
- O’Hare (Blue Line): 2,218,561 entries
- Washington/Wabash: 2,204,188 entries
- Fullerton: 1,846,778 entries
- Washington (Blue Line): 1,815,390 entries
- Chicago (Red Line): 1,776,949 entries
- Belmont (Red, Brown, and Purple Lines): 1,775,484 entries
- Roosevelt: 1,737,006 entries
- Grand (Red Line): 1,659,478 entries
Seven of the top 10 are downtown, in and around the Loop. O’Hare stands out: the Blue Line’s airport station is third by total entries, about 9,500 on an average weekday. The other two are Fullerton and Belmont, the North Side transfer stations for the Red, Brown, and Purple Lines.
Why Clark/Lake and Washington/Wabash jumped
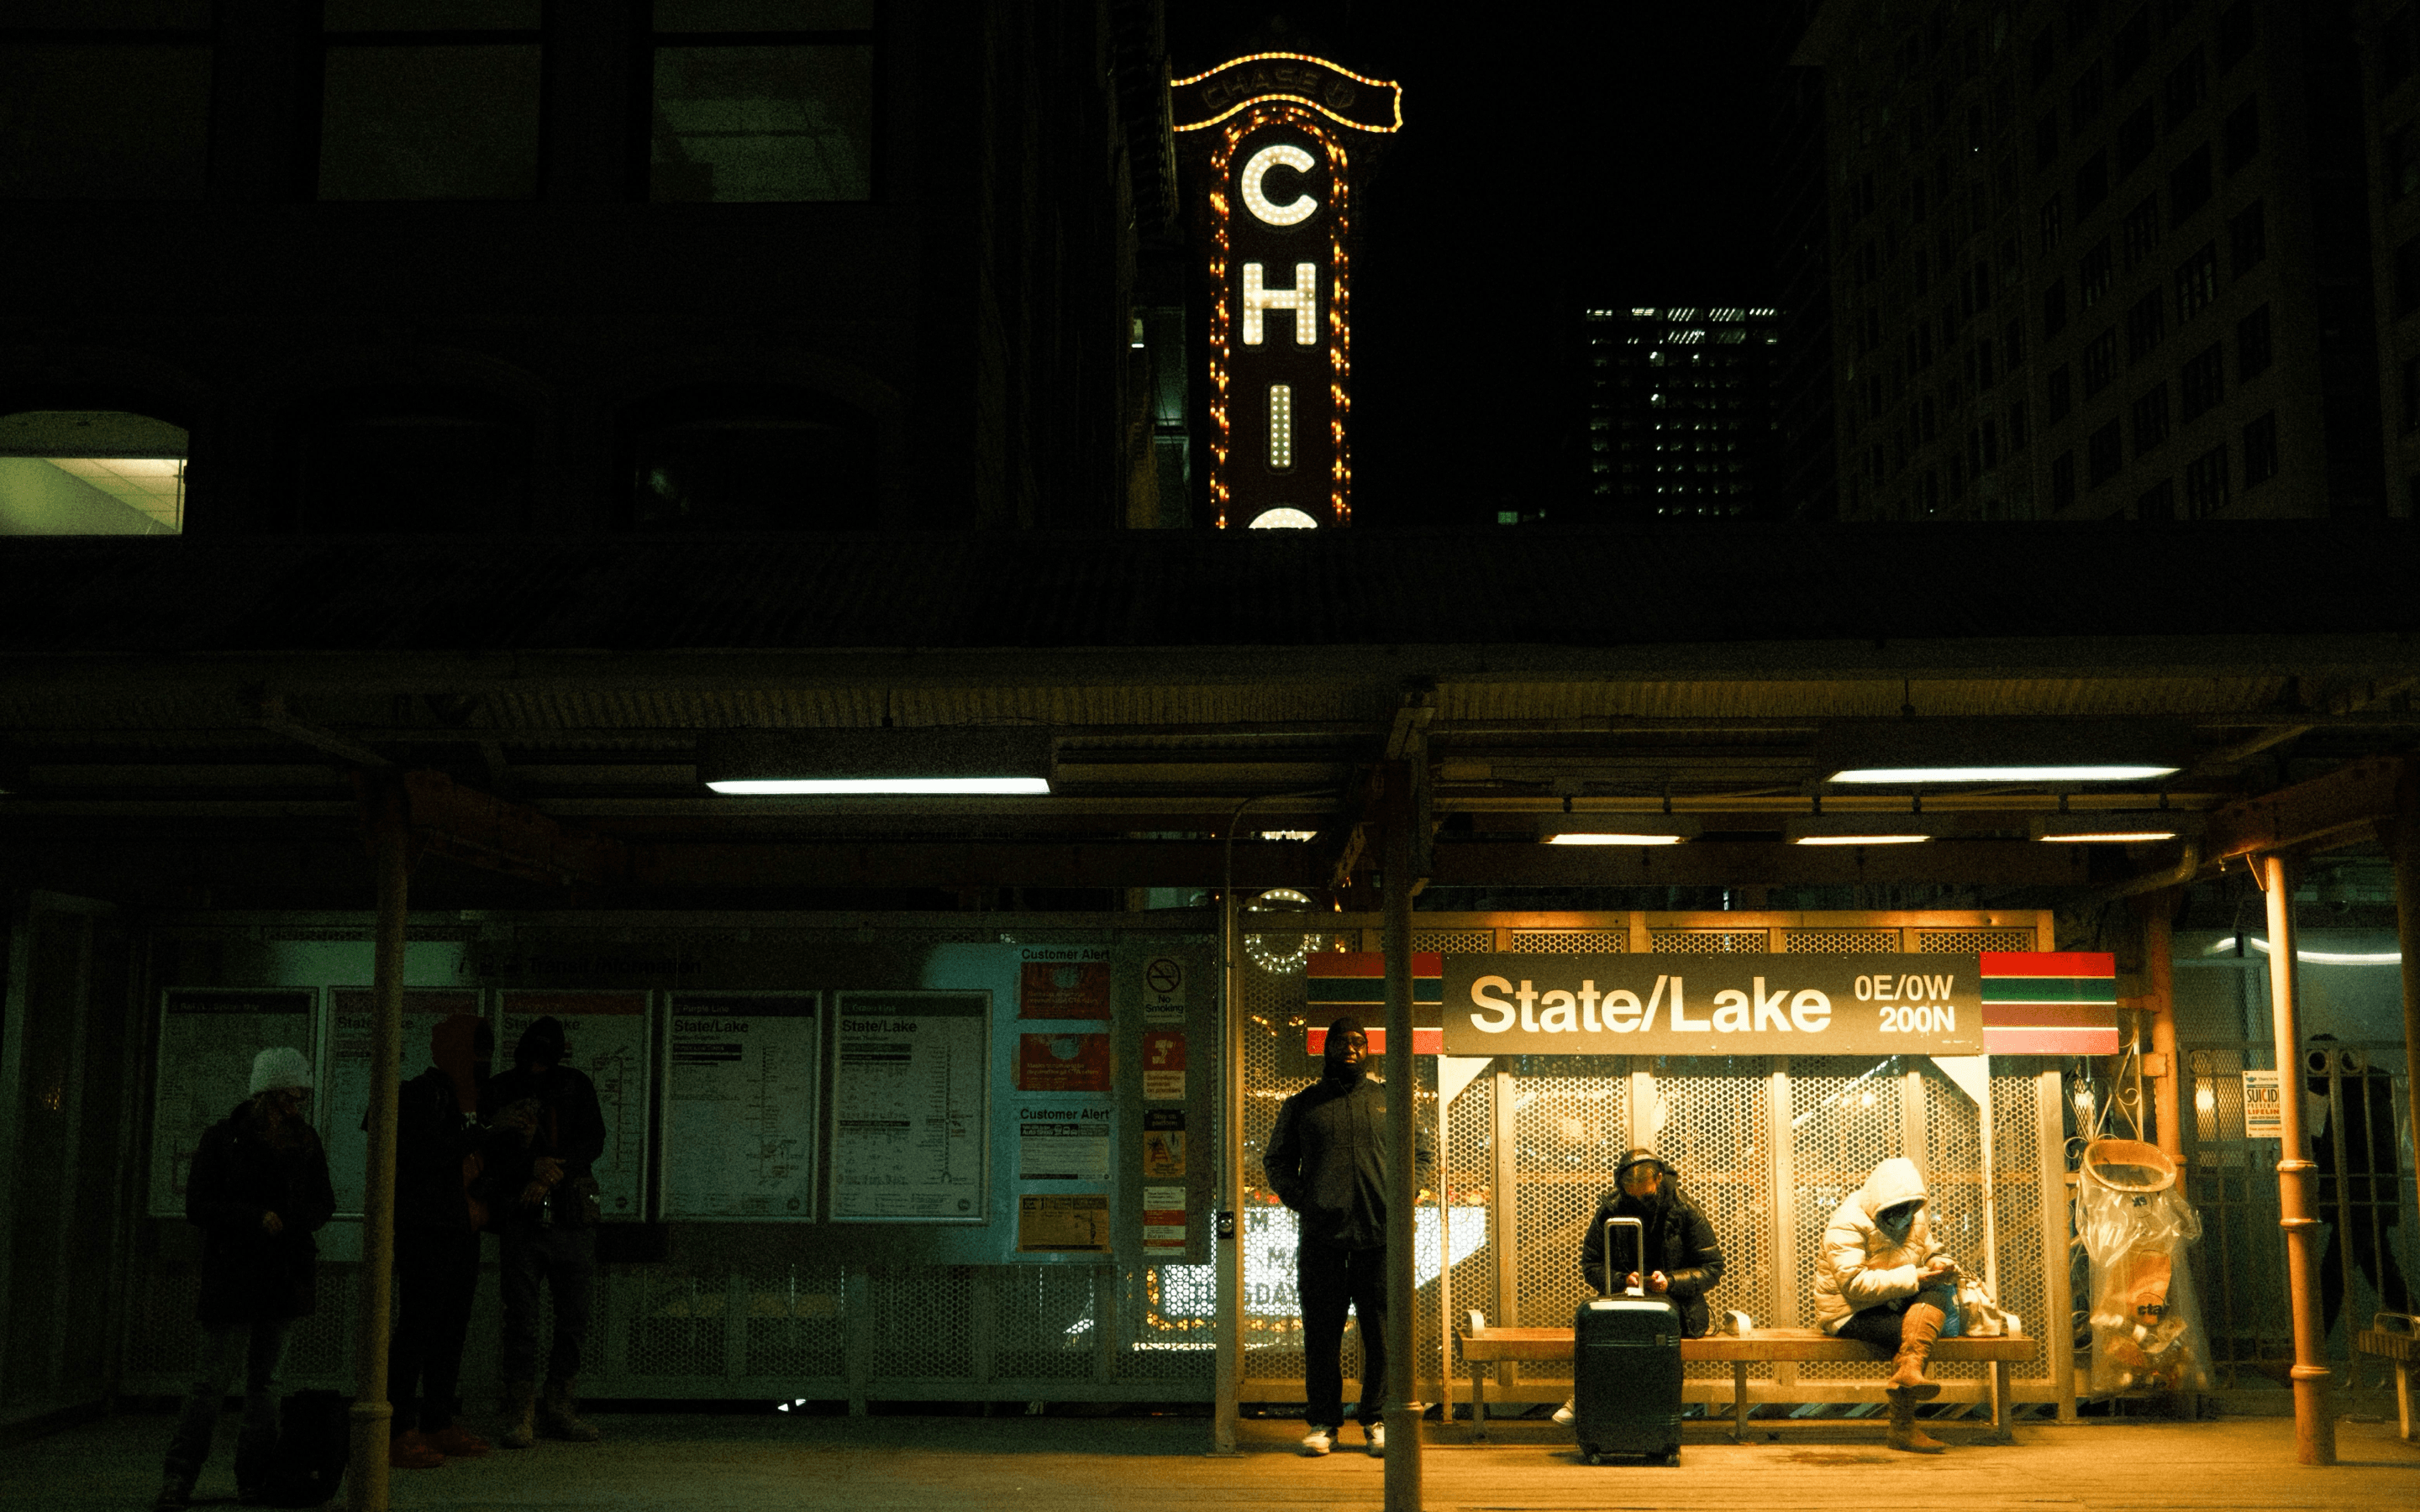
The State/Lake elevated station closed on January 5, 2026 for a three-year rebuild, and the CTA sent its riders to Clark/Lake and Washington/Wabash. Clark/Lake gained 526,000 entries over 2025 (up 25%), and Washington/Wabash gained 723,000 (up 49%). Together that’s about 1.25 million entries. Even after allowing for ridership growth across the system, that’s roughly 60% of the 1.78 million entries State/Lake had in the first eight months of 2025.
That shift is why Clark/Lake took the top spot this year. It already connects the Blue Line subway with five elevated lines, and it’s one of the two stations taking State/Lake’s riders while it’s closed.
The 10 busiest CTA bus routes in 2026
Rides from January through August 2026:
- 9 Ashland: 4,271,150 rides
- 53 Pulaski: 3,914,609 rides
- 79 79th: 3,835,460 rides
- 66 Chicago: 3,647,188 rides
- 8 Halsted: 3,461,965 rides
- 3 King Drive: 3,379,113 rides
- 77 Belmont: 3,279,177 rides
- 4 Cottage Grove: 3,271,560 rides
- 22 Clark: 3,269,689 rides
- 49 Western: 3,220,871 rides
The busiest bus routes run long distances along major streets, and most of them serve the South and West Sides: Ashland, Pulaski, Western, 79th, King Drive, and Cottage Grove. The 53 Pulaski grew the most of the top 10, up 19.7% from 2025. Three carried fewer riders than last year: the 66 Chicago (down 10.8%), the 8 Halsted (down 5.4%), and the 79 79th (down 0.4%).
Biggest gains: the rebuilt Red Line stations
Outside the Loop, the biggest gains came at the four Red Line stations that reopened on July 20, 2025, after four years of reconstruction. Lawrence and Berwyn were closed until then, and this year they’ve had 463,000 and 426,000 entries. Bryn Mawr, which ran as a temporary station during construction, is up 69%.
How this compares with Transit Stats riders
Transit Stats riders’ busiest stops are Belmont, Fullerton, and Chicago, and their top bus routes are the 77 Belmont and 36 Broadway, because our users skew toward the North Side. See the Transit Stats ranking, the most common commute routes, and the CTA ridership growth data. Flying out? Here’s how to get to O’Hare and Midway on the CTA.
Sources
- City of Chicago Data Portal: CTA L Station Entries, Daily Totals (January 1 to August 31, 2025 and 2026)
- City of Chicago Data Portal: CTA Bus Routes, Daily Totals by Route (January 1 to August 31, 2025 and 2026)
- ABC7 Chicago: State/Lake station closure takes effect (January 5, 2026)
- WTTW: Lawrence, Argyle, Berwyn and Bryn Mawr stations reopen (July 21, 2025)